Page 88 - ar2023_en
P. 88

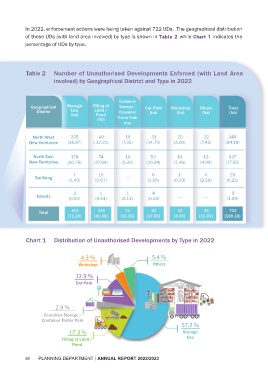
In 2022, enforcement actions were being taken against 722 UDs.  The geographical distribution
            of these UDs (with land area involved) by type is shown in Table 2 while Chart 1 indicates the
            percentage of UDs by type.


             Table 2     Number of Unauthorised Developments Enforced (with Land Area
                         involved) by Geographical District and Type in 2022


                                                      Container
               Geographical    Storage    Filling of   Storage /   Car Park   Workshop    Others       Total
                 District        Use       Land /     Container     (ha)        (ha)       (ha)        (ha)
                                 (ha)       Pond
                                            (ha)     Trailer Park
                                                        (ha)

                North West      225          40          10          31         20          22         348
              New Territories  (38.87)    ( 12.21)     (7.95)     (14.70)     (3.00)      (7.45)     (84.18)


                North East       178         74          10         52          10         13          337
              New Territories  (30.78)     (27.69)     (2.30)     (10.34)     (1.46)      (4.99)     (77.56)


                                  7          10                      6          1           4          28
                 Sai Kung                                ---
                                (1.40)     (0.67)                  (1.56)     (0.03)      (2.59)      (6.25)

                                  3          1           1           4                                  9
                 Islands                                                        ---         ---
                                (0.24)     (0.51)      (0.11)      (0.43)                             (1.29)

                  Total          413         125         21          93          31         39          722
                               (71.29)     (41.08)    (10.36)     (27.03)     (4.49)     (15.03)     (169.28)


             Chart 1     Distribution of Unauthorised Developments by Type in 2022


                                     4.3 %                           5.4 %
                                    Workshop                         Others

                                   12.9 %

                                   Car Park
                                             P


                          2.9 %
                    Container Storage /
                    Container Trailer Park
                                                                                  57.2 %
                                17.3 %                                            Storage
                             Filling of Land /                                      Use
                                 Pond

            85    PLANNING DEPARTMENT | ANNUAL REPORT 2022/2023
   83   84   85   86   87   88   89   90   91   92