
Page 42 - ar2022_en
P. 42
Building Age, Ownership and Condition
About two thirds of the IBs (i.e. 880 IBs) were built before
1987 and about 60% were situated in “I” and “OU(B)” Majority of the pre-1987
zones in metro areas. More than 28% of the pre-1987 IBs under single
1
IBs (i.e. 254 IBs) were under single ownership , mainly ownership are located in
in Eastern Kowloon and Tsuen Wan. Despite the aging Eastern Kowloon and
stock, most of the IBs were in fair (about 89%) or good Tsuen Wan
(about 7%) condition.
Vacancy
2
The overall vacancy rates of private flatted factories and private storage buildings in 2020
were 6.4% and 5.4% respectively. Vacancy rates have been maintained at relatively low
level (below or equal to 6.8%) since 2015.
KEY FINDINGS AND OBSERVATIONS
An on-site survey to collect information of IBs was conducted from December 2019 to
December 2020. The findings are approximated from the surveyed units (some 45 753
units) under stratified sampling.
Usage
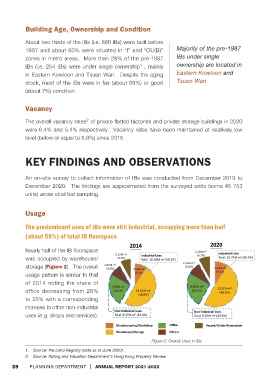
The predominant uses of IBs were still industrial, occupying more than half
(about 58%) of total IB floorspace
Nearly half of the IB floorspace
was occupied by warehouse/
storage (Figure 2). The overall
usage pattern is similar to that
of 2014 noting the share of
office decreasing from 28%
to 25% with a corresponding
increase in other non-industrial
uses (e.g. shops and services).
Figure 2: Overall Uses in IBs
1. Source: the Land Registry (data as at June 2020).
2. Source: Rating and Valuation Department’s Hong Kong Property Review
39 PLANNING DEPARTMENT │ ANNUAL REPORT 2021-2022